
How To Build Agentic BI
A glimpse into our wild BI future

Two out of thirty. That’s how many people raised their hands at a recent conference I attended here in Detroit when the presenter asked, ‘How many of you have used Claude Code or Codex or Cursor or anything like that.’ Two. If that’s shocking to you, congratulations, you’re in the bubble. People in the bubble ask ‘so how are you building your harness?’ over conference coffee. People outside the bubble think a harness is something you put on a horse.
Most of the world is outside the bubble.
In BI that means point-and-click dashboard mode; AI debugs code, but otherwise it’s the same old workflow from 2019. That workflow is slow and manual and produces a ton of friction. In tech we hate friction; in reality, friction is often the only thing that forces quality. So it makes sense that people are afraid to hand the BI reins over to AI, where getting a single number wrong can destroy your reputation. Vibing seems frictionless in a bad way that signals chaos to practitioners and data leadership.
However the advantages of AI coding BI in ease, speed and front end customization are getting too big to ignore. What we need is an AI built BI set of practices to give us quality without friction, and that’s what I’m trying to develop. Here is an example of a classic BI application I built in about six hours, along with the steps I took to give it something close to real BI rigor without clicking around a screen.
Thank you MotherDuck for sponsoring Super Data Summer here on the blog. Read this article then try your hand at Agentic BI in their DiveMaxxing contest for your chance to win a Mac Mini. Details here.
Picking A Tool
One of the challenges with agentic BI is a total lack of infrastructure. Building agentic BI is much more like software engineering than classic data development, but many data teams don’t think that way and don’t have the tooling. Things like git, CI/CD and analytics-as-code have been slow to spread, especially at the enterprise. But without these things you really are inviting chaos if you vibe code BI.
For this example I used only two tools: Claude to scope, design and write code, and MotherDuck for database, orchestration, computation and rendering. MotherDuck is this blog’s current sponsor and a close partner of mine; it’s also legitimately my favorite ‘analytics stack in a box’ provider. Full transparency.
MotherDuck offers three things that make this possible: A high performance analytics database; a react app development, management and viewer tool called Dives; and a new python execution environment called Flights. All of these tools are very simple and that’s their beauty for agentic coding. They provide the fundamental blocks of an ETL, data warehouse and BI application and rely on Claude (or ChatGPT) to do the building via MCP or API. There are some limitations - for example, MotherDuck doesn’t offer row level security or a robust BI content management system. And you don’t need an all-in-one to do this by any means. But the advantages of a single place to manage the full pipeline can’t be ignored.
Meet The Financial Briefing Book
The biggest objection I see to agentic BI is not in its ability to build a dashboard - AI can clearly build dashboards more quickly and flexibly than any BI tool. Instead people often point to older, more foundational BI patterns like standard reports with complex personalization and distribution patterns as the type of thing AI coding can’t easily do. So that’s what I set out to replicate.
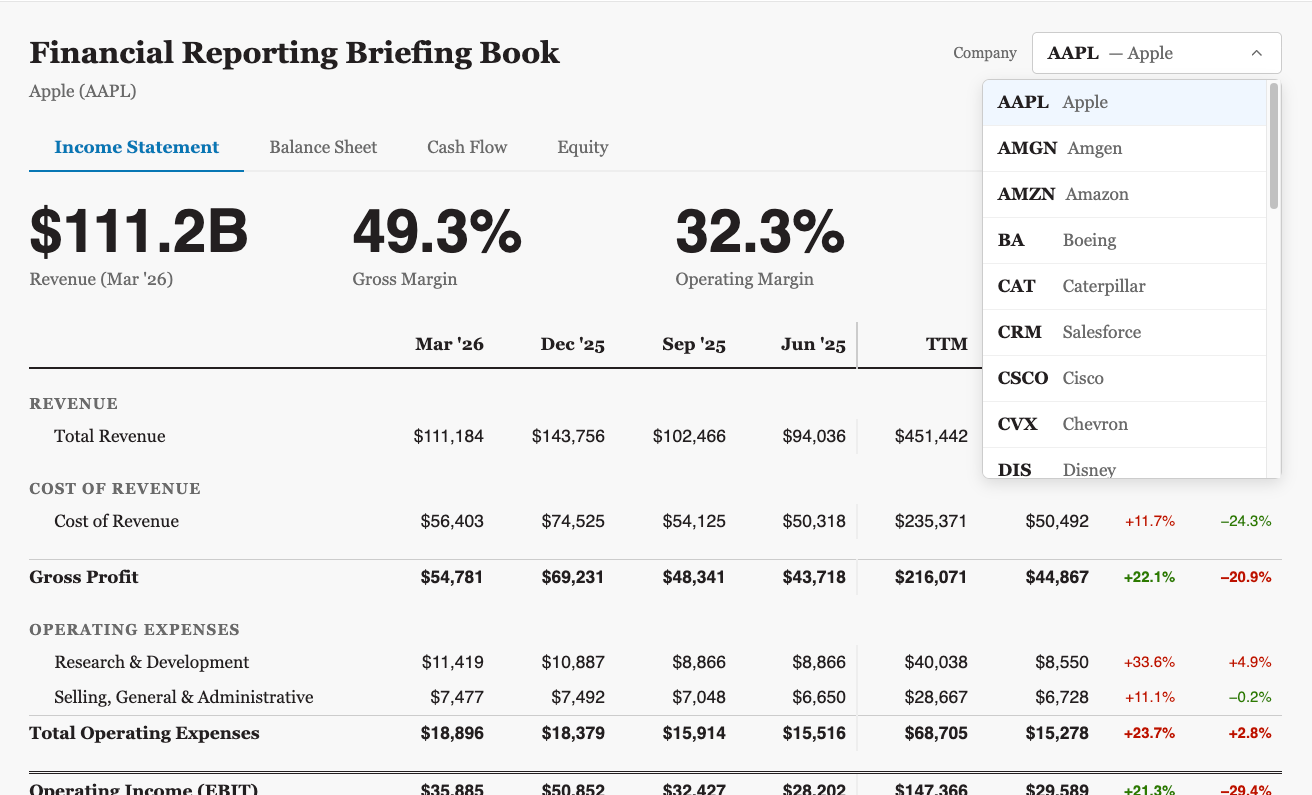
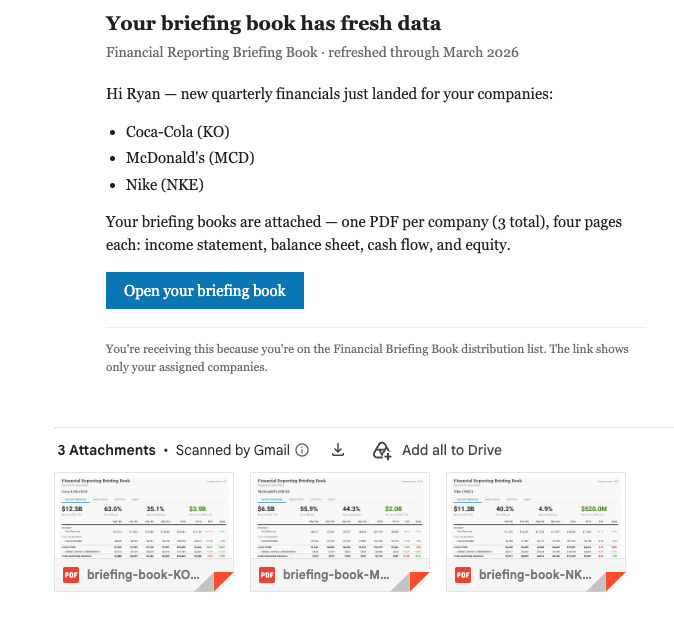
Say hello to the Financial Reporting Briefing Book - a report that pulls data from Yahoo finance and renders the big 4 financial statements for each of the Dow Jones Industrial Average companies. This type of report is very difficult to build in most BI tools made in the last 20 years, which focus almost exclusively on dashboards. And yet this style is fundamental to how most large companies operate to this day, particularly in finance.
Building this report and deploying it as a Dive in MotherDuck took less than an hour. But the form factor itself isn’t the trick - it’s the automated end-to-end pipeline that pulls fresh data, personalizes it per recipient and distributes it online and as a PDF over email that is the hard to replace BI infrastructure. So I built that too.
First, I created a version of report that pulls the ID of the person logged in via the md_user() function and compares it to a table that maps usernames to filter values at runtime. This ensures each user only sees the companies assigned to them when they view the dive on the MotherDuck server.
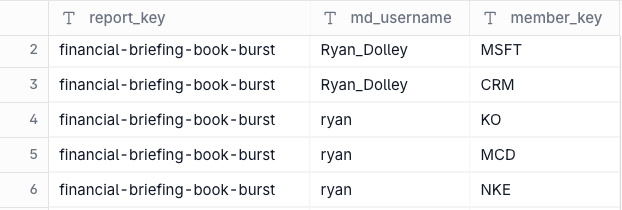
So we have interactive personalization and filter-level security in place. What about automated distribution via PDF - aka ‘report bursting.’ That was a bit trickier. I built a ‘burst table’ for recipient information including full name and email.
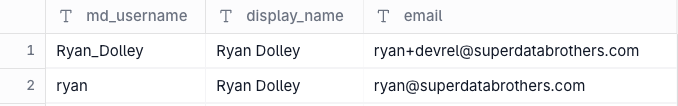
The two tables combine to give you the identity, email address and filter set for each report recipient. Now for the hardest part - distribution. Here’s where the new Flights capability comes into play. For this I built two Python applications. The first ETLs the data from Yahoo Finance into a data warehouse every morning. The second dynamically builds a four page PDF per company and emails them to recipients based on the combinations in the tables above at 9AM Eastern every day. The third… we’ll get to in a bit.
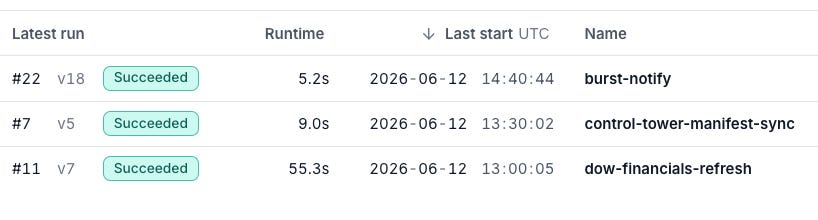
The PDF generation looks at each individual and what company combinations they receive, then constructs a complete briefing book with all four pages for each company, attaches them all to a single email and sends it out along with a link to the live environment. It has failure states built in to prevent duplicate or empty emails.
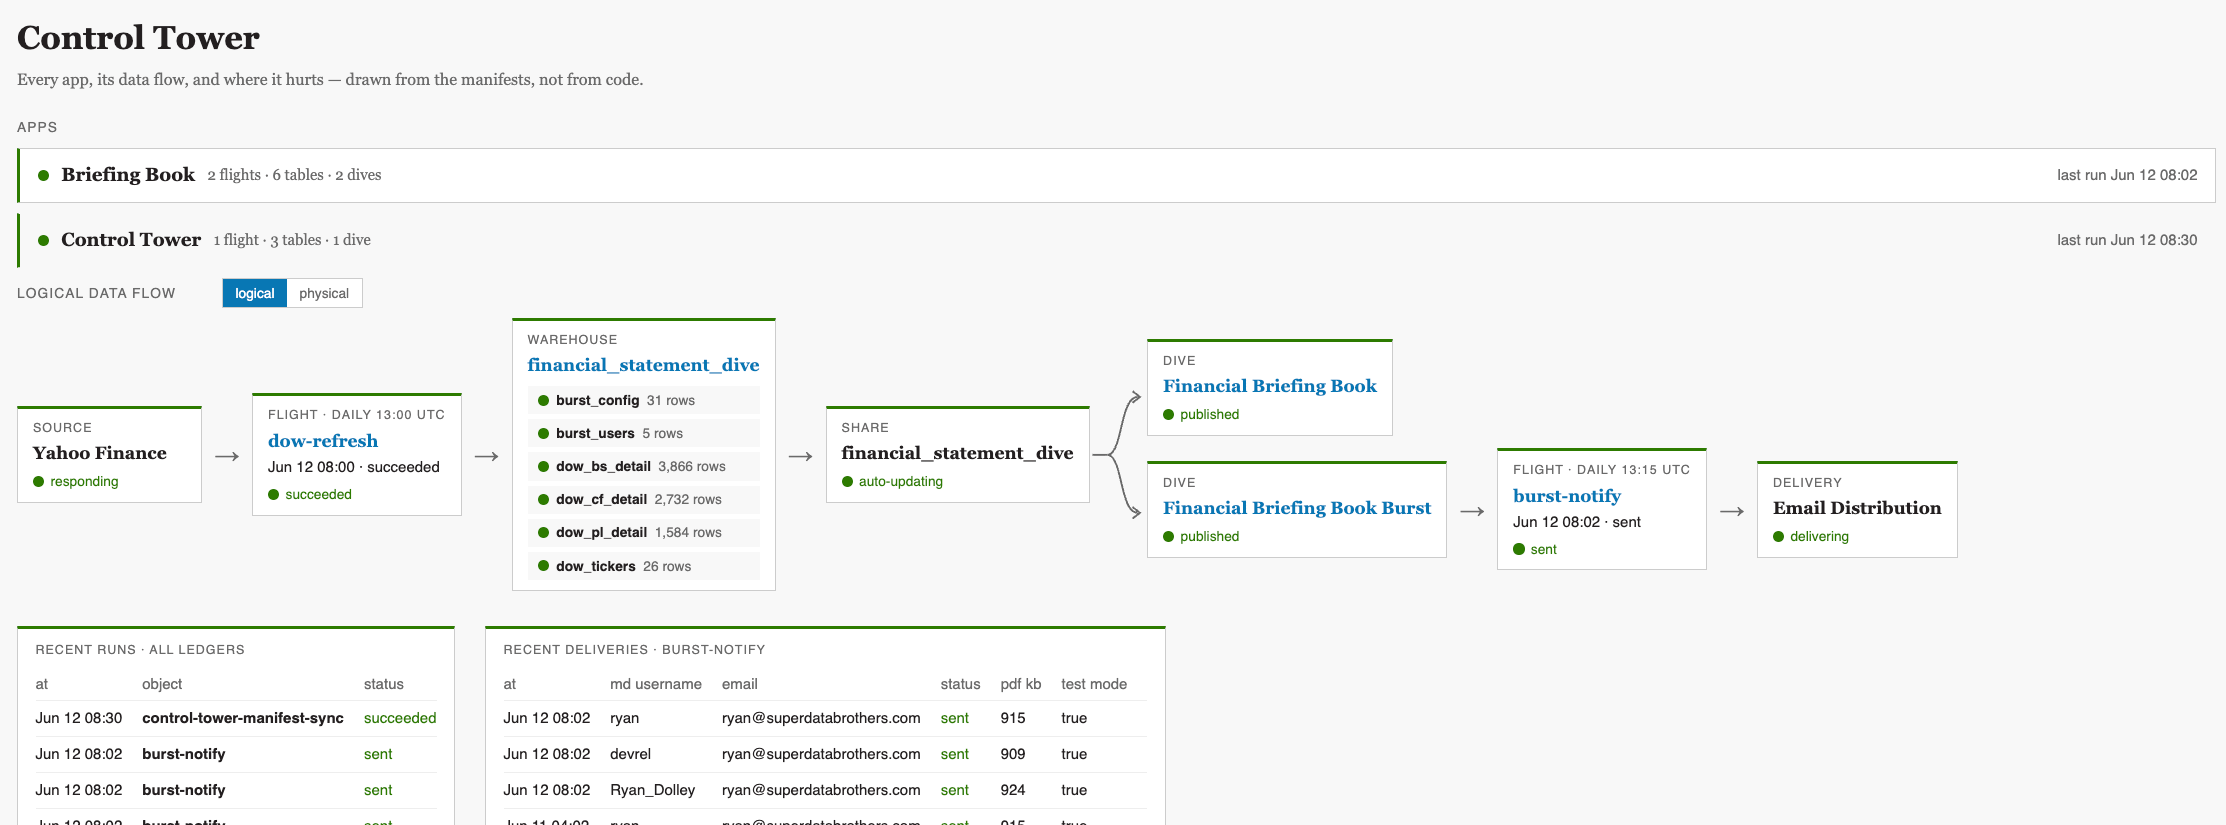
This all got fairly complicated with multiple Python Flights and Dive reports, calls to 3rd party email services, database loads, orchestration, etc. How could I ensure it was running properly and quickly analyze and debug if it fails? I actually built an app for that too called Control Tower. It automatically analyzes a MotherDuck environment, builds the logical and physical models and captures execution and recipient run status and history. It does this by analyzing the MotherDuck catalog, audit and run history tables I built, and an object manifest appended to each code file to dynamically map the environment at runtime.
All of this was accomplished with about six hours of work spread across two days. It’s been running for almost a week with zero downtime. A small test, but a real one.
Agentic BI Principles In Action
How was I able to do this so quickly and effectively? It was simple but not easy. Here are the high level principles you should follow:
Taste And Experience Matter
A CEO could not have built this, nor could an early career analyst or developer. I knew the correct structures to build and the most effective language to describe them. I understand the common failure states and could recognize them by analyzing the build plans before writing a single line of code. The ability to judge architecture, project plans and output quality on aesthetic and product-market fit grounds matters a ton for this kind of work.
Use Plan Mode
Plan Mode in Claude is amazing. Turning it on and describing the shape of your development goals causes Claude to create a detailed step-by-step proposal of how and what it will build. Using your taste and experience to evaluate and shape these plans saves enormous amounts of time, frustration and tokens and improves final output quality. Don’t skip this, ever.
Prompting With Invariants
My most effective prompts combined invariant conditions - something that must always be true - with the reason it matters. For example when building on June 9, the first Flight merge silently dropped ~540 rows of aging-quarter detail due to how Yahoo Finance operates, which caused some reports to have missing quarters. Once I identified the issue, I didn’t work with Claude on a point solution. Instead I provided the invariant rule and the reasoning behind it like this:
The tables can never shrink. Yahoo finance drops old records that we want to retain to properly render the reports.
Stating an invariant principle like this prompts Claude to fix the specific problem, comb the code for other instances that violate the principle, and write its own data quality checks into the pipeline to enforce it.
Probabilistic Reasoning, Deterministic Processing
Everything Claude does must execute as code and be treated like real software. Claude can build analytics internally by firing up hidden tools and burning a ton of tokens, but this results in one-off outputs that you can’t replicate in a second session if you try. Instead, make Claude commit everything it does to disk as files and version them like code. Make sure it builds checks into each process that you can fall back to when things don’t work - rules like ‘the row count can never go down’ are written into Claude’s context files AND the Python pipeline to become both a reasoning guide and a deterministic fallback that prevents errors and improves data quality.
Increment And Test
Each step is built and tested independently with verified and documented handoff standards. Working on the front end, the pipelines and the orchestration at once introduces too much cognitive load and clutters Claude’s context with too many variables. Once the full system exists you can do broader, cross-stage development. But to start, one thing at a time.
Tests should be isolated by design to only route to you. For example, email bursts don’t go to anyone else until you really trust the application. Build a ‘test mode’ and ‘production mode’ into the app, where switching to production is only changing a few variable values. This makes promotion easy.
Never Silently Destroy Data
It’s possible for Claude to mistakenly delete rows, tables or entire databases, even if you give it instructions not to. Write the ability to destroy data silently out of your code and require Claude to edit and execute that code instead of freestyling on its own. Transaction tracking, grow-only merges and verification queries help avoid true vibe coding disasters.
Manifests On Every Object
Each code file must have a manifest describing what it is, what it does, what objects or databases feed into it, and what objects or databases feed out of it. This makes it easy for Claude to find and understand each part of your app structure. Without manifests it’s easy to lose track of the overall shape of your application and very hard to construct process flows after the fact.
Personalize Through Data, Not Code
Resist the urge to personalize by forking code or creating ‘Briefing_Book_Steve_Final_FINAL_V2’ style reports. Minimize the file count and personalize by query filters and render variables. Build customization into the underlying data structures where they are auditable and extendable.
Capture The Context
You will make hundreds of little decisions while vibing. At the end of every session, ask something like this:
What decisions did we make, design patterns we uncovered, or universal rules we applied that should be stored for future development or shared with others?
Let Claude propose a list of what context needs to be stored for re-use, then write it to disk as a markdown file. Provide that markdown file as part of all future development.
How To Start Your Agentic BI Pilot
If you’re one of the twenty eight people who didn’t raise their hand, don’t panic. You aren’t behind - or rather, everyone’s behind, even the people at the front of the race. Here are some practical steps you can take to get started.
Pick one real report to build. Not a sample, not a demo. Something you would normally build by hand that somebody will actually read. If it’s not worth reading, it’s not worth the effort.
You really only need two tools. An AI code assistant like Claude, Codex or Cursor, and a place to run SQL. Hosted Python and React become important when you want to share with others, and it’s worth planning for them now. But the bare minimum to start is just a coding buddy and a place to send your SELECT statements.
Plan before you code. Understand what the point of the app is and be ready to articulate how it delivers value for end users to your AI. Then flip on Plan Mode and describe what you want and how it benefits your users. Argue with the plan instead of the output. This is where your experience does real work and separates you from the pack.
Write everything as a file. If AI did something you can’t re-run from disk tomorrow, it might as well not have happened. No hidden tools or one-off magic.
Give it rules, not fixes. When something breaks, state what rule was broken and why. Let AI hunt down everything that violates the rule and propose fixes.
Capture Context. What did you do and why? What rules did you uncover that can be re-used for future development and shared with your team? All of that must be captured in markdown.
Go live in test mode. Production identical output routed to you and your team until you trust it. Flipping to production just changes routing rules, nothing else.
The friction doesn’t disappear with these agentic BI principles - you are still writing deterministic processes, still rigorously testing, still developing in a non-production capacity before you flip to live. But you’ve moved it out of your clicking hands and into code that checks itself at 9AM every morning whether you are watching it or not. That’s Agentic BI.