
We don't have time to do it right, but we do have time to do it twice!
How to gauge appropriate up front effort on your data work

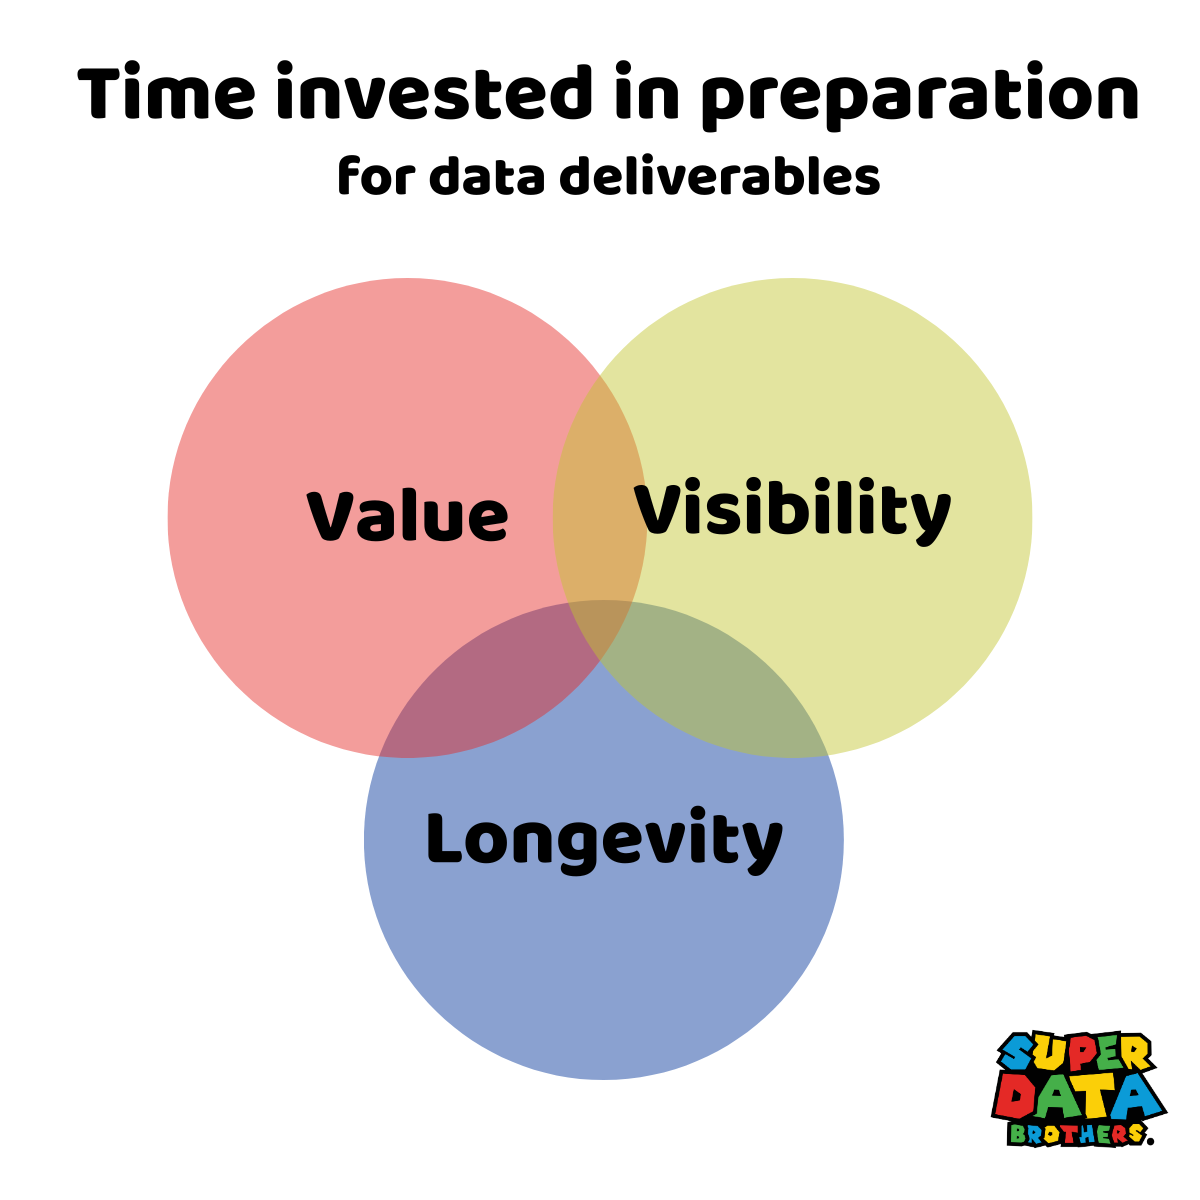
You’re under pressure to move fast. You ship a dashboard in a day, skip testing, patch it later, and now it’s a landmine. We’ve all done it. But what if we had a better way to know when speed is right and when to slow down? Here’s the framework I use to decide how much effort to invest before putting the first version in front of stakeholders. I call it the nexus of value, visibility and longevity.
Ship now and ask questions later?
I perfectly understand the pressure you are under to ship your data work ASAP. Business moves fast and today’s mandatory metric is tomorrow’s abandoned dashboard. Urgency is paramount - but unquestioned urgency leads to poor decisions, skipped steps and sloppy, abandoned work. Understanding the value, visibility and longevity of a data request gives you the ammunition you need to slow down and do it right when appropriate. It also helps you ensure your work is worth the wait - nobody likes to wait three months for a low impact request.
Breaking down the Value - Visibility - Longevity Framework
Let’s break down what these terms mean and why they matter.
Value is the project’s importance to decision-making or its direct and measurable operational or revenue impact. Value is not a vibe or a hunch, it flows urgent busienss needs, clearly defined KPIs or direct leadership requests. Anything else is noise.
Visibility is a combination of the sheer number of people impacted plus the praise or blame you will get if it goes wrong. If a thousand analysts are building dashboards on incorrect metrics, that’s high visibility. Likewise, if the CEO is the only person who will ever see this data request, well… that’s maybe more visible than the thousand analysts.
Longevity is simply the length of time the data work is expected to be relevant. This is the most neglected axis in data work. Teams over-invest in throwaways and under-invest in artifacts that live for quarters or years. For example, in data modeling longevity may push you away from the short-term convenience One Big Table (OBT) and into something more resilient and reusable.
If you only take one idea from this section, make it this: Longevity deserves more of your attention.
Right sizing your data efforts
Once you honestly assess all three components, deploying VVL becomes simple.
Low on all three: Quick and dirty is fine.
High on one: Move fast but polish the rough edges.
High on two: Slow down and make a real investment.
High on all three: Treat this like a product release with all that entails.
This isn’t a rigid process, it’s judgment with structure that puts you ahead of most practitioners. It trains your team and stakeholders to stop expecting pixel-perfect dashboards when the request is low-value, low-visibility, and short-lived. It also builds credibility when you say, ‘This one’s worth waiting.’
How to use Value-Visibility-Longevity
You can apply VVL thinking in two key places: Internally within your team and externally with stakeholders.
Internal to the team, use it regularly in grooming, planning, and retros. Treat it as a heuristic when prioritizing tasks—and because it’s not an exact science, track how often your bets are right. Are you investing in the right work? Are you flagging low-VVL requests correctly? Nothing’s worse than making someone wait three weeks for a dashboard no one opens.
External to the team, introduce VVL early in stakeholder conversations. Once they understand it, they can start framing their own requests in these terms and you’ll have the language to push back on unexamined urgency. Try: ‘We can get you something quick, but this one’s high visibility and long-lived. A little more time means fewer risks later.’”
Not a silver bullet, but a damn good compass
VVL thinking is not the only tool in your data leadership kit, but when applied correctly it’s enormously helpful in deciding when to slow down, take a breath, push back a little and do something right.
Try it. Apply it. Report back.
Catch up on the best of Super Data Brothers
Season 3 of Super Data Brothers is in full swing and we’ve already dropped some real banger episodes. A big thank you to GoodData for underwriting this season. Check the replays out:
Databricks AI/BI tool review - Full breakdown of AI/BI and Genie’s strengths and gaps
Making data more human with Tiankai Feng - Design and empathy in data work
Fight health insurance denials using AI with Kolden Karau - Healthcare AI to save your life
Surviving the data engineer job crunch with Eevamaija Virtanen - Career strategy and good vibes
Don’t miss us LIVE today at 12:00PM EDT where Scott Taylor joins us to show how great storytelling wins real budget!
We’ve got a killer lineup this season, mark your calendar every Thursday at 12:00PM EDT
May 29th: Metabase review - What works, what doesn’t, what to do about it
June 5th: Malcolm Hawker - Masterclass in data governance and metadata strategy
June 12th: Ramona Truta - Practical AI deployment in the enterprise
June 19th: Joe Reis - No introduction needed!
June 26th: Jean-Georges Perrin - The data contract guru debates the data product master!
Catch the full show archive here!
Upcoming appearances
Analytics Without Engineering is Just Reporting with Joe Reis and Matt Housley
Tuesday, May 27th at 12:00 EDT, registration required

Join Joe, Matt, and me for a live GoodData webinar on the future of Analytics and AI and why a code-first approach isn’t optional in 2025.
Tech Show Frankfurt June 5th - 6th with GoodData

I’ll be speaking live on Tuesday and hanging out at the GoodData booth throughout the event. swing by, say hi, and test my terrible German.
That’s it for now - hope the start of your Summer is great!
Cheers!
Ryan
Bonus question: This entire post was written listening to the album Moon Safari by the dreamy, retro-futurist French pop band AIR. What’s your go-to ‘it’s time to be creative’ music?